

The advent of satellite navigation and the birth of Google Earth, Google Maps and France’s Geoportail have alerted everyone involved in the management of catastrophes to the value of geographical information systems. By François-Xavier Goblet
Geographical information systems (GIS) allow the user to represent and process various types of data on computer-generated two or three dimensional maps. They can take numeric and alphanumeric information, such as addresses by post codes or geographical coordinates, plot them on the map and facilitate increasing levels of analysis through the graphic overlay of layers of additional information on the original output.
Historically, GIS have been used in such applications as land development decisions, information mapping and geographical analysis of marketing. Now, they are proving their value in catastrophe risk management. Bringing together databases of spatial information with geographical applications with various processes, such as triage, selective research and risk foot print modelling, facilitates the understanding of risk. It is, for example, possible to analyse the exposure of an insurance portfolio to a climatic event in near real time, the vulnerability of a zone to seismic risk or to see its density of population.
Insurers and reinsurers
Using a GIS and incorporating the specific details of its own portfolio, an insurer or reinsurer can perform many types of analysis, for example, the accumulation of values in different types of geographical zone, such as country, state and even city. Integrating this information with the typology of natural hazards, historical earthquakes and flood zones, cyclones and typhoons, and population density gives insurers and reinsurers an indispensable method of understanding their exposures. In this way, they can define their accumulation zones and understand the implications for their capital allocation.
Risk managers
The value that an insurer or reinsurer finds in the knowledge of the exposure of its portfolio to certain types of risk is similar for risk managers, and on a smaller scale. While insurers or reinsurers can take advantage of a mass of information and rely on the law of large numbers, risk managers do not have the luxury of this amount of data. Therefore, their analysis needs to be at a finer level.
Analyses by GIS allow identification, quantification and analysis of the risk of a company’s portfolio according to the type of risk, such as the exposure of an industrial plant to environmental risks. This knowledge will permit the risk manager to identify the most vulnerable sites. In this way, he can create a plan of action to reduce the worst risks and also define the need for insurance.
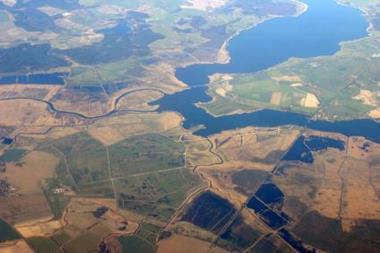
Analysis of flood risk
Earthquakes, storms, hurricanes and cyclones, typically affect a far wider geographic area than flood, but the types of damage that earthquakes and wind produce are relatively homogenous across on the same surface. Their impact is similar across the whole area. By contrast, the impact of flood can vary from one place to another across the same site. It depends partly on the depth of the water, its speed of movement and duration of standing, the rate at which the water levels rise and fall in each flood zone, and the quantity and type of debris.
In combination, all these parameters have a direct impact on the property damage inflicted by flood, as well as the business interruption loss.
The following steps allow the property owner’s risk manager, usually with the help of a specialist engineer or the insurer, to identify where it will be most effective to invest in risk mitigation and define the most appropriate limits for insurance or reinsurance.
1. Geocode the portfolio to create a map of sites owned or insured by the client.
2. Add the total value or insured value of each site.
3. Superimpose numeric flood maps, usually 100 year high water events, and client facilities.
4. Create a visual representation of the results on a portfolio and local level.
5. Identify the most sensitive sites according to their potential for flood and value.
6. Plan risk mitigation measures and estimate the probable maximum loss (PML).
7. Adjust the insurance or reinsurance programme accordingly.
Crisis management
The era of GIS is also that of climatic information in near real time from around the world. Bringing this abundance of data together with a GIS containing details of specific sites, whether buildings or infrastructure, means that important information can be displayed and communicated in a simple to understand way, by catastrophe managers of all types.
Conclusion
The era of GIS transforms completely the previous reference tools for insurance and risk managers and those for use in crisis management. They bring together information from the numeric electronic files (raw data, Excel spreadsheet or diagram) with the geographic program, risk map and spatial analysis. This third dimension gives more substance to the information and facilitates its understanding. It is a radical transformation of information that has a bright future.
Postscript
François-Xavier Goblet is a loss prevention engineer with AXA Corporate Solution’s GIS program VisioRisk.
francoisxavier.goblet@axa-corporatesolutions.com