


Risk managers should focus on enabling success rather than avoiding failure – and one way to do that is to quantify the likelihood of success. Alex Sidorenko, chief executive of Risk Academy, explains how
My friend, Norman Marks, has been talking about rebranding risk management for years. Norman calls for risk professionals to focus on enabling success rather than avoiding failure. I think this is brilliant advice. A way to communicate risk management insights to executives and the Board is to talk about the likelihood of success.
Well, the good news is that likelihood of success is actually easily quantifiable. Myself and many of the risk managers I know have been doing exactly that for the last seven years.
Here is a step by step guide:
Step 1. Determine what is considered success
This should be quite easy to do, because most modern-day organisations have some form of strategic objectives that are designed to measure whether the strategy is being achieved or not. So, in the context of this article, the likelihood of success is the same as the likelihood of achieving an objective. Different objectives will have different likelihoods of being achieved. Usually there is more than one objective.
For arguments sake, let’s use “profitability above 10%” as our measure of success. The company will consider it a good year if it managed to achieve profitability 10% or higher. I could’ve chosen any objective whatsoever, this one was the easiest because I already have the diagrams saved and won’t need to run the calculations again. Again, any objective can be the measure of success.
Step 2. Use influence diagram to determine key stakeholders, assumptions and risks
Once we determined the objective, we need to break it down into smaller components, because our brain is not very good at thinking about abstract problems with multiple factors at play. An influence diagram or a causal map seems like a good tool to use.
These simple visual tools help us identify key stakeholders and determine what some of the assumptions/inputs that influence the achievement of the objective (a key assumption is any hypothesis that management have accepted to be true).
At this stage, I would usually use a CIA tool called key assumptions check, it comes handy to validate the assumptions. Here are some questions to ask:
- How much confidence exists that this assumption is correct?
- What explains the degree of confidence in the assumption?
- What circumstances or information might undermine this assumption?
- Could the assumption have been true in the past but less so now?
- If the assumption proves to be wrong, would it significantly affect the objective?
If the objective value (in our case is profitability) is calculated using MS Excel we would normally try and trace from the output cell (objective) to all the inputs cells (assumptions). This will become the foundation for the later analysis.
Some of the assumptions that would go into our hypothetical “profitability above 10%” example include:
- forecasted cost of raw materials
- forecasted FX rates and inflation
- forecasted sales prices
- forecasted sales volume
- forecasted amount of investment needed for new equipment
- forecasted loan interest rates
- forecasted admin expenses and so on…
Another part of assumption validation is to make sure that all significant risks have been considered when calculating the objective. Chances are they haven’t. So, we need to double check by identifying potential risks and adding them to the business plan. For example, all calculations could be done in local currency. This implies that there is no FX exposure, which may not be true, so sometimes, the risk manager needs to add FX rate to the formula to make sure FX risk is accounted for.
Step 3. Add volatility and run the simulation
By the end of this step, risk managers should have a list of management assumptions. For every management assumption identified, risk managers should work with the process owners, internal auditors and utilise internal and external information sources to determine the ranges of possible values and their likely distribution shape. Replacing single point assumptions with distributions is the key risk management task.
In his book, Flaw of Averages, Sam Savage did a great job at summarising the maths on why using single point estimates, the so called “most likely” or “average” figures is pretty much guarantees to lead to bad decisions.
For example, management believes next year it will sell 15 engines, but this is uncertain, they could sell less or could sell more. Sales volume is actually a distribution and because management can’t sell 12.34 engines, it’s actually a discrete distribution.
Once all key assumptions have been changed to distributions, we can run a simulation. Running simulations is now almost effortless, because the software is free (ModelRisk, SIPMath) and computers are powerful enough.
This is what we get after a simulation with 10000 trials:
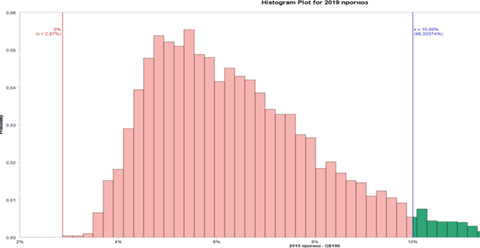
So what does the likelihood of success looks like?
Unless the management makes changes to its assumptions and business plan, the likelihood of achieving the objective “profitability above 10%” is 3.7%, that means 96.3% of the time the objective will not be achieved. Not a very good business plan if your salary and bonus depend on it.


1 Readers' comment