Infrastructure is an essential element in the immediate, as well as long term, recovery from a catastrophe. Identifying geological risks to infrastructure projects is, thus, an essential part of catastrophe risk management. By Matthew Free and Sara Anderson
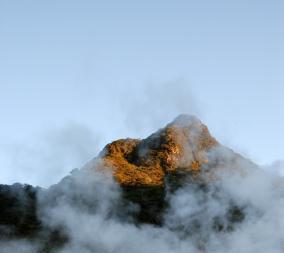
Geological oR geohazards include some of the most cataclysmic natural events, such as earthquakes, volcanic eruptions and landslides. The long linear extent of infrastructure facilities, in particular transport and pipeline networks, makes them especially vulnerable to such risks, as they can pass thorough many different geological settings and, hence, sources of hazard along their routes. Once a route has been selected, it is rarely possible to relocate the entire alignment to avoid hazards, such as landslides or active faults, but some local change may be possible to minimise the potential impact.
Geohazards may also be more subtle and include ground movement from swelling, shrinking, compressible or collapsible soils, and soluble rocks such as limestone and salt.
While these less catastrophic processes often do not catch public attention, they can still have a very significant effect. For example, the British Geological Survey (BGS) in 2006 estimated that damage to UK property from heave and subsidence caused by the swelling and shrinking of clay during the previous decade was in excess of £3 billion.
Desk study for geohazard risk
A comprehensive desk study at the earliest possible phase in the planning of an infrastructure project should form the initial basis for the identification of geohazards as part of a risk management process. The desk study will consider:
• The geographic region of the site and the potential geohazards
• The geology and geomorphology of the site or route to identify potential site specific geohazards
• Historical development of the area, including historical records of damage or repair which may be indicators of geohazards
The desk study is more than a compilation or database of existing information. It needs specialists who understand the geological processes that form the earth and continue to drive deformation and alteration of its surface to study the available information. They will recognise the traits recorded in solid and superficial geology and geomorphology and develop a geological model of the region which can be used to assess its susceptibility to geohazard events.
In reality, the geohazard data, even from all of the available sources, is incomplete both spatially and in time. For example, few countries have inventories of active faults, and fewer countries have inventories of landslides. Most active volcanoes are defined, but few are well monitored. This deficiency in data is widely recognised, and there are international initiatives to rectify the situation, such as the supra-national Integrated Global Observing Strategy (IGOS).
It will not be possible to identify all geohazards through visual examination of the surface or from available records, so intrusive and non-intrusive ground investigations are a key stage in identifying any additional geohazards and determining the extent of those identified in the desk study.
Desk study – data sources
The internet provides a wealth of global information on the most significant geohazards, for example:
• United States Geological Survey (USGS) natural hazards support system (http://nhss.cr.usgs.gov) has databases covering a range of hazards, including earthquakes, active volcanoes and hurricane tracking.
• British Geological Survey database GeoIndex (www.bgs.ac.uk) has spatial information on a broad range of hazards, including landslides, swelling and shrinking clays, soluble rocks, compressible and collapsible materials, earthquakes and flooding. Information related to other hazards associated with soil and water chemistry is also available.
Geographical information system (GIS) software is particularly useful for filtering and combining large amounts of spatial data. Figure 2 shows an extract from a GIS based natural hazards database for Turkey indicating locations of earthquake epicentres, active volcanoes, selected active faults and tsunami events, as well as topography and bathymetry, in relation to the country’s highway infrastructure.
This map highlights the sheer amount of data that should be collected and assessed and the potential vulnerability of long linear infrastructure assets, as a proposed road passes close to epicentres of previous seismic events along its route. Other relevant information, such as geology, precipitation, population and value at risk, can also be viewed within the same platform.
Remote sensing technologies are increasingly useful in the identification of geohazards or, more precisely, the identification of features (lineaments and anomalies) that can be interpreted as resulting from active or potential hazards. There is an array of established and new remote sensing technologies, which can provide not only a visual image of an otherwise potentially inaccessible or remote area, but also more detailed survey information than may be obtained from publicly available sources, such as national surveys.
Geohazard estimation
There are well established methods for the quantification of geohazard risk. J. W. Pappin and other authors described an example of a regional seismic risk analysis for building stock in 2005. A schematic illustration is shown in Figure 4. This method is generally in accordance with that used in the hazard analysis software package HAZUS for the United States (FEMA, 2003). A similar method can be adopted for assessing the risk to structures such as bridges along an infrastructure route.
The method includes the determination of seismic ground motion hazard levels, referred to as ground motion demand curves, and of building capacity curves. The building capacity curves define how structures will respond when subject to seismic ground motion. The intersection between the demand curves and the capacity curve is used to determine the probability of different levels of damage (slight, moderate, extensive and complete).
To determine the economic loss due to damage from seismic ground motion, a damage cost ratio is applied to each damage state. This cost ratio is a proportion of the replacement value of the building.
In this case, cost ratios of 2%, 10%, 50% and 100% were assumed for slight, moderate, extensive and complete damage respectively. This method also serves as a basis of assessing casualties from the damage by linking the likelihood of different severities of injury to the building state.
Summary and conclusions
Geohazards pose significant risks worldwide, both in terms of human and economic losses.
There are many readily available and straightforward tools and techniques to help identify geohazards and the associated risks. It is essential to identify the risks early in an infrastructure project, as the cost of risk management measures invariably increases as the project develops. A systematic approach allows the risks to be managed in a way which helps to ensure they are acceptable or tolerable and that disproportionate sums are not spent in reducing risk to impractical levels.
Postscript
Matthew Free is a geohazard and risk specialist and associate director in Arup.
Sara Anderson is a civil engineer and an associate in Arup.
Email: matthew.free@arup.com
Email: sara.anderson@arup.com
Website: www.arup.com
References
• British Geological Survey BGS (2006). www.bgs.ac.uk/britainbeneath/hazards
• FEMA (2003). Multi-hazard Loss Estimation Methodology, HAZUS MH Technical Manual. Federal Emergency Management Agency, Washington DC
• IGOS (2004). Integrated Global Observing Strategy. Geohazards theme report. For the monitoring of our environment from space and from Earth. April 2004 (www.igospartners.org)
• Pappin J.W., Free, M.W. & Vesey, D.G. (2005). Methodology to Study the Seismic Risk to Buildings in a Modern High Rise City in a Region of Moderate Seismicity. Second UEE Conference, Japan, 2005.