


Cargo accumulations. Hard to understand. Harder still to quantify. Until now. By Herbie Lloyd
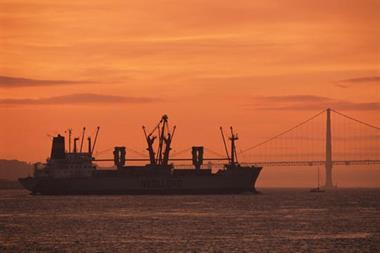
Branscombe Beach, Devon. A container vessel lies grounded a mile or so off the coast, while on the beach people are clambering over containers washed ashore, picking through debris, scouring the site for anything of value. Although it sounds like a 19th century ship wreckers' tale, this was actually the scene in January 2007 after the containership Napoli came to grief in the English Channel during windstorm Kyrill.
The mainstream media pounced on the people's beachcombing efforts, giving them more column inches than the environmental impact on the coastline, and far more than the £50 million salvage operation. But behind the headlines and ignored by the press, there was yet another story: the fate of the Napoli's cargo from an insurance perspective.
Cargo insurance is unique. It covers goods that are exposed to an enormous array of risks both on the high seas and in ports. It deals with different cultures, different regulatory systems and different climatic systems. Cargo insurance is valuable. It is at the heart of international trade and, by extension, the global economy.
For 2006, the members of the International Union of Marine Insurance (IUMI) reported around $20 billion in total marine premium, nearly half of this for cargo. Cargo insurance presents the underwriter with one of the oldest and possibly the toughest conundrums in the industry. "To estimate cargo exposure with a reasonable degree of accuracy," says Fritz Stabinger, secretary general of IUMI, "has been impossible for decades."
The holy grail in all insurance is control over risks and profitability. Yet, with the number of shipments and shipping movements, it is impossible for insurers and especially reinsurers to assimilate details of every single shipment on the covers they write.
In the light of the emergence of enterprise risk management, as well as the focus on cost of capital by investors, it is clear that effective accumulation control can mean the difference between success and failure for the insurer. "There is no doubt that the management of cargo accumulations represents one of the biggest challenges facing marine underwriters today," says Rich DeSimone, former president of IUMI.
Take for example the huge explosion on 21 March 2006 that rocked the container ship, Hyundai Fortune, en route from the Far East to Europe through the Gulf of Aden. Some 60 to 90 containers fell into the sea and a massive fire spread through the stern, the accommodation block and the stacks forward of the accommodation. Secondary explosions followed as seven containers full of fireworks also ignited. The result was one of the largest and most complex cargo claims in history, the ramifications of which continue today.
The Napoli and Hyundai Fortune were not especially large ships. The capacity of containerships is given in 20 foot equivalent units or TEUs, and they were 4,734 TEU and 5,551 TEU respectively, compared to the largest container ship, the 2006 built Emma Maersk which is 14,500 TEUs.
Taking the risks on board
The underwriter needs to be able to monitor exposures policy by policy, from day to day. He or she needs an accurate picture of what commodities are being transported, their ports of origin and discharge, and also any ports of call, and the voyage timings. To date, such a picture has been out of reach.
Guy Carpenter has, therefore, devised a new approach to modelling the likely risks to ocean cargo at any ports where it is stored.
The approach is two pronged; it uses a huge database that we have created to analyse exposure accumulations and a well established modelling system to assess cargo vulnerability to natural perils.
The exposure analysis technique creates a picture of the magnitude and seasonality of international trade volumes at global port locations. The database, called the Guy Carpenter International Trade Database (ITD), holds historical trade patterns for over 25 countries around the world. This tool enables the underwriter to estimate the total value of cargo stored at specified ports at any time of the year and to identify the likely cargo types involved. It can also help estimate the total value of cargo on board specified vessels operating on specified trading routes.
With this tool, the underwriter can apply specific patterns for specific analyses and so can assess peaks and seasonality more accurately. Take, for example, Japan, one of the world's busiest trade hubs. Total trade throughput was $102 billion in April 2007 alone. The ITD indicates that 82% of this trade passed through the top 20 ports, with the top seven ports accounting for 60% of all trade. Of these Narita Airport, Nagoya, Tokyo and Yokohama were the busiest.
Narrowing trade patterns down to product types, using the ITD's data split functionality, reveals that in April 2007 over 74% of all goods travelling through Japan's ports were petrochemicals, electrical goods, industrial machinery, metals and chemicals. This pattern is not greatly dissimilar to the rest of the year, although exact volumes change from month to month due to seasonal effects.
When cargo is stored at an airport or seaport for any length of time during its shipment, it becomes vulnerable to the same risks that face property on land. Therefore, we use a commercial catastrophe model, the Risk Management Solutions (RMS) industrial facilities model, to model vulnerability to natural perils.
RMS requires not only location data and exposure values, but also a detailed assessment of the vulnerability characteristics of each cargo type at each location. The ITD's product categories are used to split the total port exposures into separate and homogeneous vulnerability groupings. In this way, different vulnerability parameters can be assigned to individual product groups within the catastrophe model.
Vulnerability is a function of peril intensity. For Japanese exposures, for example, RMS analyses the vulnerability of specified cargo exposures to over 27,000 predefined earthquakes and 11,000 predefined typhoons. In addition, the earthquake model includes an assessment of damage relating to fire following earthquake.
Running the model for Japan, looking at probable maximum losses (PML) for earthquake, shows a loss estimate of at least $281.2 million from the worst 1% of earthquakes in Japan, or a 1-in-100 year event. By analysing the modelled losses at this return period level, the study indicates that Yokohama, Tokyo, Narita Airport and Chiba would contribute most heavily to this level of loss. All sit in or are close to Tokyo Bay, so any event that affects one will almost certainly have some impact on the other three.
This suggests that these ports are considered highly correlated with respect to earthquake loss potential. Yokohama was further found to generate the highest average contribution to losses beyond the 1-in-100 year level, even though it is only the fourth largest port in exposed value terms. Hence, Yokohama can expect to suffer catastrophe losses more as a result of its high vulnerability to earthquake than due to its high cargo exposure value.
The area of cargo exposures is complex, and we are further mapping this intricate terrain by combining the two pronged modelling process with other tools. One such tool is a web enabled data management platform, called i-aXs. With the cargo model and i-aXs working in tandem, the underwriter can visualise the port exposures he is analysing. He can calculate accumulations and determine aggregate exposure to natural disasters in real time. He can also consider the impact of covering specific product types. Not only this, but he can also aggregate marine exposures with property exposures. See Figure 1
Conclusion
Marine insurance is at the heart of international trade, and so plays a significant role in the global economy. Advances in risk management result in more effective insurance. This in turn helps enhance the world economy by supporting national economies, and defraying the economic cost of catastrophes. Better management of cargo accumulations is one such advance. It also serves as a call to underwriters to continue to supply comprehensive risk information that will contribute to developing the technology.
Counting the cost
The modelling process can also be used for individual vessels. Take the Napoli, the wrecked vessel this feature opened with. The research team gathered the export data from Belgium to Portugal and South Africa and the Portuguese export data to South Africa. From this, they assessed the product type profile and the related monetary values and quantities of the cargo. The product weightings for the constituent parts of the journey were blended to refine the final estimates for the cargo. The total value of the 41,773 tonnes of cargo on board when the Napoli was stranded has been calculated at $62 million with an average value per TEU or 20 foot equivalent unit, the standard container size, value of $25,819. If the incident had occurred after the Portugal call, these estimates would have increased to $66 million in total and an average TEU value of $27,427.
Postscript
Herbie Lloyd is actuary and project manager, cargo accumulation modelling, with Guy Carpenter Instrat in London.
Email: herbie.lloyd@guycarp.com
Website: www.guycarp.com
Further reading: Cargo Accumulation Modelling.
The Guy Carpenter Approach. September 2007. www.guycarp.com.


No comments yet