


Is it possible to identify the relative ‘attractiveness’ of different terrorism targets based on current datasets?
From March 2019, Pool Re has been able to provide cover for Non-Damage Business Interruption (NDBI) in some circumstances.
NDBI terrorism events are generally those that target the general population. Their primary objective is to harm or fatally wound people; and to instil fear and create disruption. These attacks frequently utilise knives and vehicles. They typically don’t cause property damage but can lead to business interruption losses.
Pool Re’s NDBI model contains a number of assumptions, informed by counterterrorism specialists and data analysis. These assumptions include potential targets and the relativity of one target to another.
The question we have recently posed is whether data exists which can help identify such relativities in the “attractiveness” of different targets?
Distilling down the data sets
There are a number of data sets which could be used as a proxy to help steer the analysis of relative attractiveness of targets, which can contribute to the next version of the NDBI model. For example, if such attacks are directed towards people, proxy for “daytime population” could potentially be used to help define this attractiveness.
Imagine if such data existed, by location, for every hour of every day. What would be the best grouping of such data to determine the relativities? Does this change over time – seasons (eg Christmas shopping; summer tourists)? Could we even see differences within the days of the week?
The development of such questioning paved the way to some early analysis of the Global Terrorism Database (GTD). Using enriched data from the GTD for 01/01/2014 to 31/12/2019, there have been at least 92 attacks within Europe which would have been classed as NDBI attacks in the UK – that is, a cordon would have been put in place and businesses prevented from trading.
There is huge subjectivity in whether an event would have led to it being regarded as a NDBI event, were it to take place in the UK. Only where there is a closure of business, for instance through being caught within a cordon, could there be a BI loss.
Additionally, the purpose of the data analysis should be considered. If the concern is for civilian personal safety, then perhaps ‘targeted’ attacks (eg against military or police) should be ignored, unless civilian intervention took place.
What else do the statistics tell us?
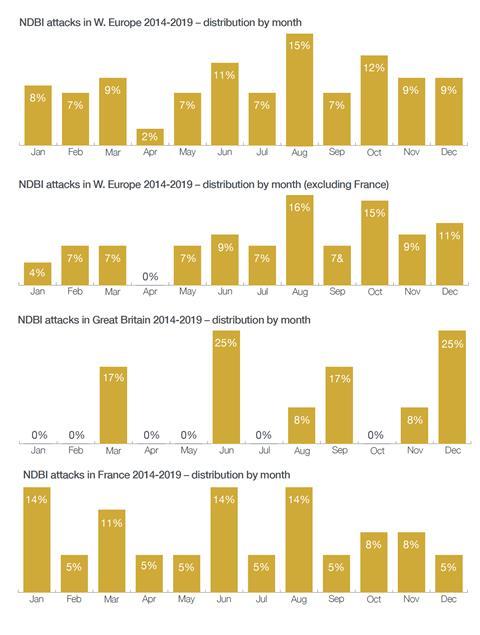
Risky months
Basic analysis indicates that the highest number of attacks in Europe are in August. However, attacks within the UK in August are comparatively lower than other months, with June and December being the highest (although this is based on only 12 data points).
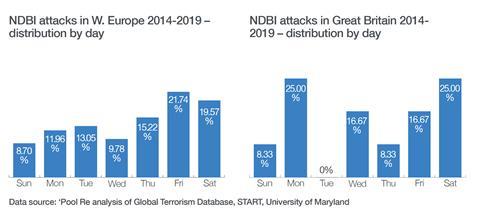
Day of the week analysis
Friday and Saturday would appear to have the most events in Europe. The picture is slightly different for the UK on its own, though Saturday remains in the top spot, together with Monday. Althought there is a paucity of data.
Does ideology of perpetrator matter?
If most events (across Europe) occur on Friday, does this change by perpetrator? Of the 92 attacks which could be classified as NDBI, 51 were carried out by Islamist extremists.
Interestingly, of those attacks inspired by or attributed to Daesh, al Qaeda or other Islamist extremists, the “most popular” choice of day for attack is Friday.
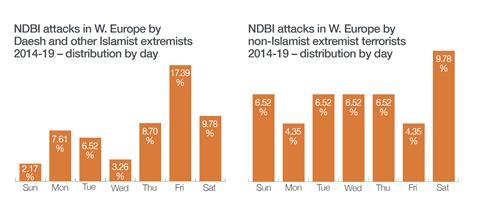
Is this indicative of the terrorists’ extremist nature – perhaps not attending the Islamic day of worship but carrying out an attack on that day instead; or attacking because of it?
However, only three of these 51 attacks took place within the Ramadan periods – this is not far from the approximate proportion that would be expected (ie one twelfth of the total) and proves inconclusive either way, suggesting that there is no significant difference within this religious period.
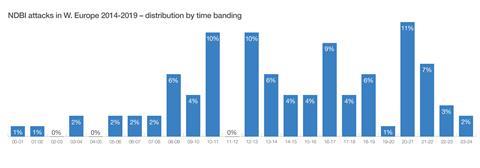
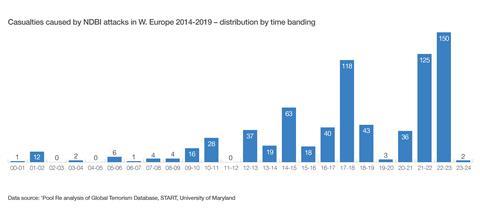
Daytime population
If we are to create an updated index to estimate target relativities according to daytime population, what periods would make the best indicators? The chart opposite shows peaks at 10-11am, 12-1pm, 4-5pm and 8-9pm (local times assumed). But the graph of casualties indicates that the most impactful attacks would happen around 5-6pm or 9-11pm – most probably when there are larger numbers of people on the streets either commuting or leaving bars and restaurants.
It may be possible in the future to look at numbers killed and injured separately and whether those include the terrorist, the specific target, or innocent bystanders.
Targeted attacks
Excluding attacks targeted towards government, military, police, religious figures/institutions, and educational establishments, we are left with an event set which is most likely to have involved the general public. We are left with less than half the original – 44 events. This suggests more than half of attacks are specifically targeted towards these groups.
Final remarks
Work is ongoing in this area, and the analysis above should be treated as cursory yet potentially interesting. GTD data are of course subject to revisions, additions and questions – this may even affect historic data. Whether an event would have constituted a NDBI event in the UK is highly subjective, and indeed this rationale may change over time.
Stephen Burr is chief actuary at Pool Re


No comments yet