


Home in on cause and outcomes not incidents and risks, writes Tony Thornton, ERM and business continuity expert
Describing risk in one or two words is meaningless. Typical examples could be: “risk – fire”, or “risk – serious injury”. Attaching key words to risk has its merits, particularly for the purposes of interrogating risk databases, but to use key words as a risk description is at best, just idle, and at worst, a huge misunderstanding of the components and the structure of risks.
Using a bow tie format facilitates a more in-depth examination of the construction of the risk as well as properly allowing a better analysis of the causes and effects.
For example, consider you are about to undertake a long drive to a key meeting, and you carry out a risk assessment of the journey. Amongst many possible future events you identify ‘car crash’ as a ‘risk’ and assess it in time-honoured (and completely erroneous – see previous blogs!) fashion as follows:
Event: car crash
Likelihood: rare (never happened before)
Outcome: serious (could result in serious injury)
Risk rating: low (depending upon your matrix configuration)
How much use is that? And yet, because of the tradition of describing risk (‘car crash’) in this manner, this is precisely the approach that many organisations take.
Far more valuable to use a bow tie to identify the causes and the outcomes of the crash
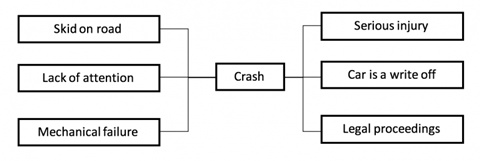
Now we can describe the risk in terms of multiple possible causes of an event which could lead to multiple possible outcomes. This is the approach the more mature organisations take, and it leads to a recognition of the components of risk, and that each component needs either preventive (left hand side) or corrective (right hand side) controls. (Effectiveness of controls will be covered in a further blog).
However, this is still not useful because it deals with Causes (left hand side), and Outcomes (right hand side). Here’s how we get a far more useful bow tie;
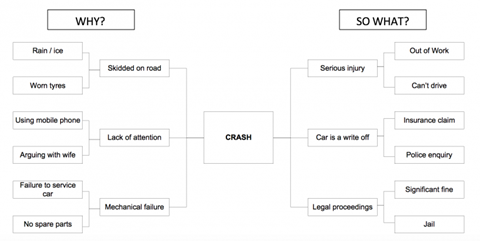
On the Left-Hand Side, for every Cause, ask “why?” This will enable you to get to a more deep-rooted cause, against which you can then apply more robust controls. Depending upon how many times you ask “why?”, will determine how far back you go – ultimately arriving at a root cause.
On the right-hand side, for every outcome, ask “so what?” Doing so enables you to identify the ‘impacts’, which is far more useful then the outcomes. Having a serious injury is a bit of a blow to the individual, but actually, so what? If the individual having a serious injury has no impact, then why assess it? But of course, having a serious injury has significant ‘impact’ such as not being able to go to work, needing hospital care, and possible post hospital care. Perhaps the injury is so bad that the individual cannot work again, and if they are the bread-winner of the family then what will the family do for an income? It is the ‘Impacts’ we are interested in, not the ‘outcomes’.
Applying our “why?” and our “so what?”, we can develop the bow tie as follows:
So, returning to the subject of this article, which part of the bow tie is the ‘risk’?
Answer – all of it. We can’t look at select pieces of a risk out of context of the other component factors. So, let’s rethink the format of our risk reporting.
One of the fantastic advantages of this approach, is that once we develop our why-so what? Bow tie, we can apply probabilities to each root cause and each impact, and start to build our Bayesian Network to look for ‘red lines’ through the bow tie – but that article is some way off yet…
For more articles from Tony, visit: www.theriskmanager.co.uk


1 Readers' comment