


Risk information isn’t always communicated on the same “playing field”. Information given to the boss may favour one solution over the other – and is the reason why most strategies fail to deliver expected results. But there are other hidden elements at play, writes Adrian Clements, international enterprise risk manager
For good decisions you need good information. As decisions are a comparison between multiple possibilities, and the decision taken is the best choice between these possibilities, then it’s clear that the same framework for information is needed. Information given to the boss is typically chosen to make one solution appear better than another. But there are other hidden elements at play here. And these are the reason why most strategies don’t deliver the expected results. Not only is the playing field not flat but there is more than one playing field where different rules are being used. So how can you make strategic decisions based on input from different fields and even different games?
Maybe you’re not aware of the differences or even what I’m talking about. So, I will give two simple examples.
- You have a corporate headquarters located in London. Your risks are weather, Brexit, market volatility etc. These form your benchmark and your measuring stick. One facility is located in Mexico. Their measuring stick is earthquakes every day, kidnap and ransom, corruption etc. Some hurricanes but also market volatility, exchange rate etc. As earthquake, K&R is normal it’s not a risk, only a problem. These risks are not reported or reported with a higher appetite level. The costs associated with the mediation of these risks’ forms part of the overall cost of doing business in these countries.
- Two plants, identical in size, production, market. One management says we are good, we know what we do, we maintain our assets. I don’t need a spare part on a critical piece of equipment. The second management says we know what we are doing, we maintain our assets but if that piece of equipment fails, I’m in trouble. One reports a risk the other doesn’t. Which one is right? Do I give the plant the money for the spare as the risk impact reported is large? How do I capture that the first plant has the same risk and I have systemic issues with spare parts?
I will go one step further. Just comparing “risk” formulas creates issues as noted below.
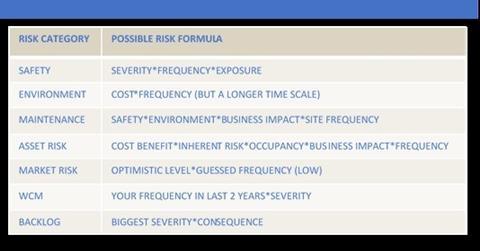
Many elements even have different timelines. From plant, region and segment level these differences are repeated, and the results are put on a risk map. As each person is unaware of the subtleties of the individual calculations then all are oblivious to the discrepancy in the results. The plant manager confirms he agrees with the mapping and that’s that. Corporate risk managers are no longer responsible.
Now if we add cultural risk differences, we see that the information received as risk manager can be different even though words and intent are the same. Solving this by saying each plant manager is responsible for the reporting of results does not reduce the fact that I will be giving flawed advice to the management. Even worse if I ask plant management to give the maximum, average and minimum impact of these risk events. There will be significant cognitive bias on each persons understanding of what can go wrong. And typically, a complete underestimation of the impact, at group level, of some of these risks. They simply don’t know. And the risk manager is simply adding these risks together with little awareness of double counting or risk consequences being locally not globally estimated.
Even though we have procedures, guidelines and rules we still have multiple playing fields and they are not flat.
There are several simple criteria we can use to normalize these risks and opportunities which are all well known to the risk manager.
- The level of inherent and residual risk of the scenario being used, ie risk
- The level of vulnerability each risk has. Ie vulnerability benefit
- The cost benefit of conducting the action
- The number of times this event can occur per year. Bringing velocity into the calculation and enhancing the window of opportunity concept
- Country risk level where the action will take place
If you already use risk adjusted NPV calculations, then you will only need to level the opinion playing field of the site management under consideration. Unfortunately heat maps are not designed to level playing fields so it’s better to use fishbone diagrams where the actual Centre line is velocity.
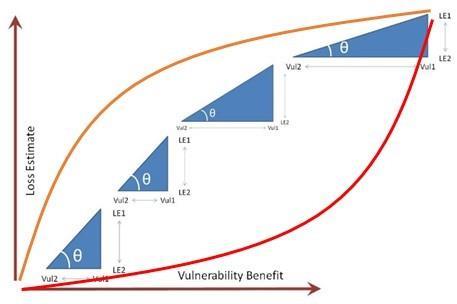
But ultimately what is your risk mitigation strategy? In simple 2-dimensional terms vulnerability first or severity? Orange or Red curve?
Transparency in action quantification now show the value being brought to the bottom line of the company. This can all be done in excel so that the complexity can be simplified. Managers see the results and know the actions are prioritised in a controlled and transparent manner.
The key to ensuring the system described delivers the value promised is ownership. As some of the steps are multifunctional then this is an important step and one in which Human Resources needs to be involved. Each manager aligned in creating value for the group as opposed to ensuring individual bonuses are reached.


3 Readers' comments