


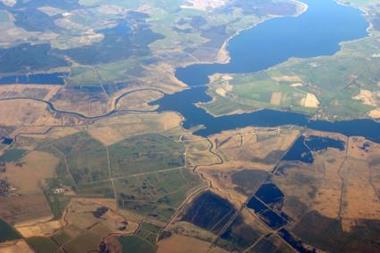
Flood maps in the United Kingdom provide a good overview and are relatively comprehensive compared to flood maps for other countries, which tend to focus mainly on high risk areas. However, the summer 2007 floods highlighted a need for more information on urban and rural drainage, small rivers and groundwater flooding. By Avis Easteal
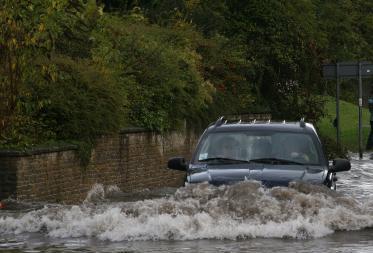
During June 2007, it became apparent from the flooding in the United Kingdom exactly how vulnerable and inadequate much of the country's drainage system is at coping with very heavy rain. Flash flooding occurred because storm drains in large urban neighbourhoods, such as the Brightside Lane area in Sheffield and around the Connswater Shopping Centre in Belfast, were not designed to handle such high volumes of water in short periods of time. Rain water that would normally have channelled into the local river through the drainage network instead ran across concrete and tarmac to inundate streets and houses.
A rural drainage issue arose because rain fell faster in narrow, steep sided valleys than the soil could absorb, or local watercourses could carry away. Consequently, the valleys filled with water, causing flooding and damage to properties. For example, Hampton Loade in the Severn valley in Shropshire saw half of its average rainfall for June in just 45 minutes. With the ground saturated, torrents of water flowed down the steep valley sides washing away a road, a section of railway track and damaging properties.
During July, the main cause of flooding was overflowing rivers. Very small watercourses are usually excluded from mapping exercises, but the July floods exposed how important it is that they are included, because some of these smaller rivers or streams burst their banks and inundated nearby neighbourhoods.
The village of Ilmington in South Warwickshire, for example, was flooded because a nearby stream, called Middle Street Ditch, burst its banks. The stream could not hold the abnormally large amount of water flowing from the areas upstream that had suffered heavy rainfall.
Another gap in the UK's flood maps, which is likely to become more urgent as winter approaches should heavy downpours continue, is groundwater flooding. Generally a mid-winter phenomenon, groundwater flooding occurs when excessive rainfall causes the water table to rise above normal levels and water rises up from the underlying rocks or flows from abnormal springs. This type of flooding can arise in some of the oddest places, such as the top of a hill.
It is estimated that several hundred thousand UK properties are at risk, but information on groundwater flooding is currently not available. This is why at Experian we are actively working to develop a mapping system that will include ground water flooding information.
Continuing challenge
Flash floods will continue to be a challenge for mapping technology providers until the lack of information on drains and rivers is addressed. Drainage maps will need to look at ground surface type, land contours, kerb height, drainage capacity and maintenance.
While the lack of information on drains, small rivers and groundwater needs to be addressed urgently, flood information can be more effective when used in conjunction with other relevant information. Mapping technologies can combine flood maps with datasets that not only highlight where a flood might occur, but also the potential level of property damage and associated costs.
Our perils model, for example, includes comprehensive datasets on rebuilding costs, derived from general rebuilding estimates and previous losses across the country. It provides a risk index by postcode that predicts the likelihood of an insurance claim from an event, such as flood or fire. We take into account the hazard and the varying vulnerability of different house types. Areas may have the same flood risk index, but the rebuilding costs in one postcode may be significantly higher than in another postcode in the same risk area.
Sophisticated mapping and risk assessment tools have greatly advanced the ability of insurers to analyse and spatially model entire policy books against any number of datasets, such as perils, to assess complete exposure to risk and sums insured. Mapping technology is fundamental for evaluating the potential impact of future floods.
Postscript
Avis Easteal is managing director of Experian's insurance services division.
Email: avis.easteal@uk.experian.com
Website: www.experian.co.uk


No comments yet