


Alexander Larsen & Ghislain Giroux Dufort of Baldwin Global talk through how risk managers can use risk management as an effective decsion making tool.
Risk Management has for a long time been looked upon as a process that stops bad things from happening rather than an effective decision-making tool that helps organisation’s form and improve their strategy, meet objectives and provide competitive advantage.
Reporting
If risk management is a decision-making tool, and identifying risks is an exercise in preparing for the future, then why do so many reports insist on looking at last quarter instead of looking forward? Additionally, too many reports focus on the old Risk Matrix or Risk Register approach of looking at the top risks based soley on Likelihood and Impact.This often results in the same risks staying on the risk register for years, or senior management focussing too much on the top 5 risks and not getting time to discuss the rest.
It’s no wonder senior management see this as an assurance exercise rather than something that should be adding value to the business.
So how can we fix it?
There are three key areas that need to be addressed.
A) linkage to strategy and objectives.The two inform each other. Linking these two allows more productive discussions at senior management level and provides real value to future development of strategy and a chance to consider emerging risks.
B) Risk visualisationin order to truly engage top management, we need to look at how we can move towards a visually-inspiring presentation of risk.
C) Timely and effective information.We need to move away from looking back at the last quarter or 6 months and move towards having up-to-the-minute information as well as having leading indicators.
Know your audience
When presenting to executive committees and Boards, a dynamic and interactive approach to risk visualisation such as that which Nico Lategan at Transport for London developed, and which is shown in Figure 1, may add value by summarising the risk register. The ability to filter out specific objectives or risks or focusing on areas of vulnerabilities at the click of a button whilst in a meeting is highly effective when discussing scenarios or strategies and demonstrates the true power of risk management in decision-making. An example of linking risk to objectives can also be seen clearly in Figure 2.
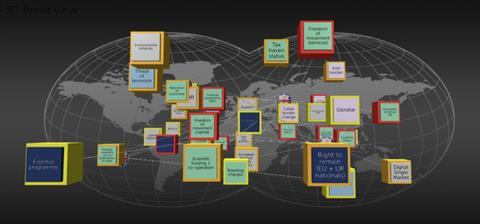
Figure 1
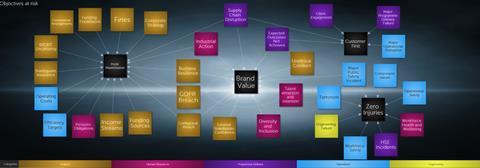
Figure 2
Nico Lategan, in the recent Institute of Risk Management “Fuelling the debate” energy publication, suggests that Senior Management teams tend to be made up of “big picture” people who appreciate being able to visualise their organisation’s strategy along with all the risks and opportunities and all the interconnectivity involved, which often leads to stimulating discussions and prompting several key decisions.
Whilst the examples above are proving effective for boards, in some cases, discussion may require more detailed information and alternative visualisation should be considered. Using bowtie diagrams for example, where you can dig deep into root causes, look at controls and their effectiveness, and link causes to lower level risks within the organisation, have been highly effective in these circumstances. The common theme is interactivity and visualisation depending on the makeup of senior management.
Risk Prioritisation
Engaging senior management by using risk visualisation is only half the battle however. Ensuring that risks are prioritised based on risk appetite and up to date information is vital to ensuring that risk management is actually adding value. One approach that has proven popular with board members has been using KRI’s and Risk Appetite.
There is much debate around risk appetite statements that are often qualitative or aspirational, limited to acceptable variations around corporate targets which, whilst looking good on paper, don’t add much value. For example, let’s assume fictitious airline company AirSafeCo states that it aims for a customer satisfaction index of 80%, plus or minus 5%. This is a nice aspiration but says little of how much risk the company is really willing to take.
A Better approach might be if the company identifies the major risks that drive such variation around the target, as well as leading key risk indicators (KRIs) that alert of changes in these risks. By establishing risk appetite statements at the KRI level, AirSafeCo obtains an early warning system that allows to be alerted of risks to customer satisfaction objectives and to take action before it is too late.
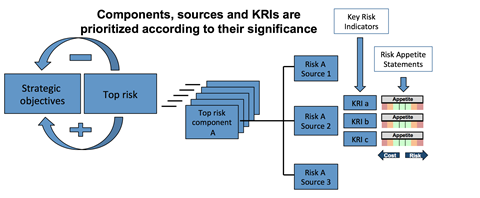
Figure 3
Figure 3, a powerful visualization tool in itself, illustrates how to use this approach. Let’s say AirSafeCo wants to be in the top quartile of the industry in terms of passenger safety (strategic objective). It identifies three associated risk components: crash, turbulence, delays on the tarmac. Risk components have different sources and manifest themselves differently. For each major risk source, leading KRIs are sought and risk appetite statements set for these KRI. For example, the time to buckle up during turbulence announcements may be such a leading KRI.
Specific and quantified statements for leading KRIs are created that consider both the level of risk and the cost of managing the risk (due to the number and cost of treatments).
Once this system is in place, it can be used to make decisions and take action at the required frequency: in real time, daily, quarterly, etc. When a KRI drifts away from risk appetite (the green zone), different actions are taken depending on the magnitude of the variation (orange and red zones in Figure 3). It is important to remember that a sensible action may be to actually reduce spending on control and take more risk, thus freeing up more resources to manage other risks or take advantage of opportunities.
This approach to risk appetite and KRIs provides real-time snapshots of the status of risks to the business and a perspective on their trends (as demonstrated in Figure 4), as opposed to the traditional likelihood vs impact matrix which often misses the mark.
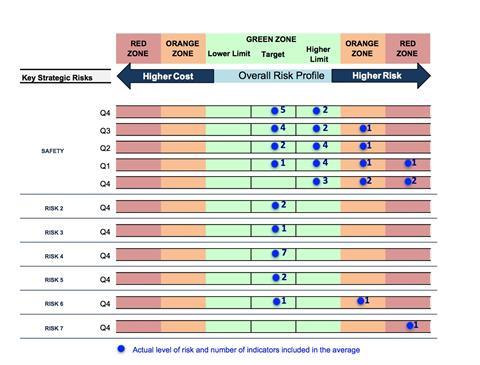
Figure 4
Figure 4 shows which risks are most pressing based on approved risk appetites for top risks. Such visualization tool also provides a perspective on how risks have improved or worsened over time, most likely due to management action, as demonstrated with Safety over 5 quarters. With leading KRIs and an adequate monitoring frequency, this table also allows for timely decision-making before risks materialize.
All companies and organisations, including not-for-profit ones, need to take risks in order to achieve their objectives and to thrive. This approach helps to make timely decisions on risk levels and cost of risk.


No comments yet